Remote Sensing Measurements of Forest Structure Types for Biomass Mapping
Canopy height derived from active remote sensing systems such as Lidar or SAR is an often used predictor for forest biomass. However, a significant amount of variance in this relationship remains unexplained. One idea how to improve height-to-biomass relationships is to consider horizontal and vertical forest structure. Ground-based tests have shown that classifying stands according to structure indices, e.g. the stand density index (Reinecke, 1933) and modified species profile index (Pretzsch, 2002), leads to more accurate height-to-biomass relationships within each structure class, compared to one single overall relationship. The goal would be to classify forests into structure types based on a horizontal and a vertical index which are derived from remote sensing data, before biomass estimation (Fig. 1). Biomass could then be estimated more accurately for each structure type.
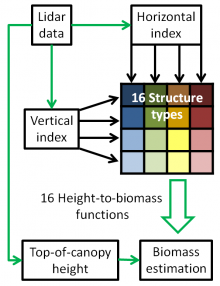
Figure 1: Workflow to classify structure and predict biomass.
We used ground-inventory and airborne Lidar data from 141 field plots of 500 m² in the forest of Traunstein, Bavaria, to develop a structure classification. The classification scheme was then applied to the German national forest inventory (BWI), which consists of 48,562 field plots distributed over Germany at a maximal spacing of 4 km. As no wall-to-wall Lidar data for Germany was available, we generated the Lidar data for the BWI plots using a simulation model. Pairwise correlations between 38 different ground-based structure metrics and 56 Lidar metrics were investigated to identify useful structure indices (Fig. 2).
A first application of the workflow showed how structure types can be derived from Lidar data using a spatially restricted set of ground inventory plots (Traunstein) to produce a large structure type map for Germany. Classification into horizontal types was easier, while classification into vertical types proved challenging. The distribution of the structure types in Germany is shown in Fig. 2.
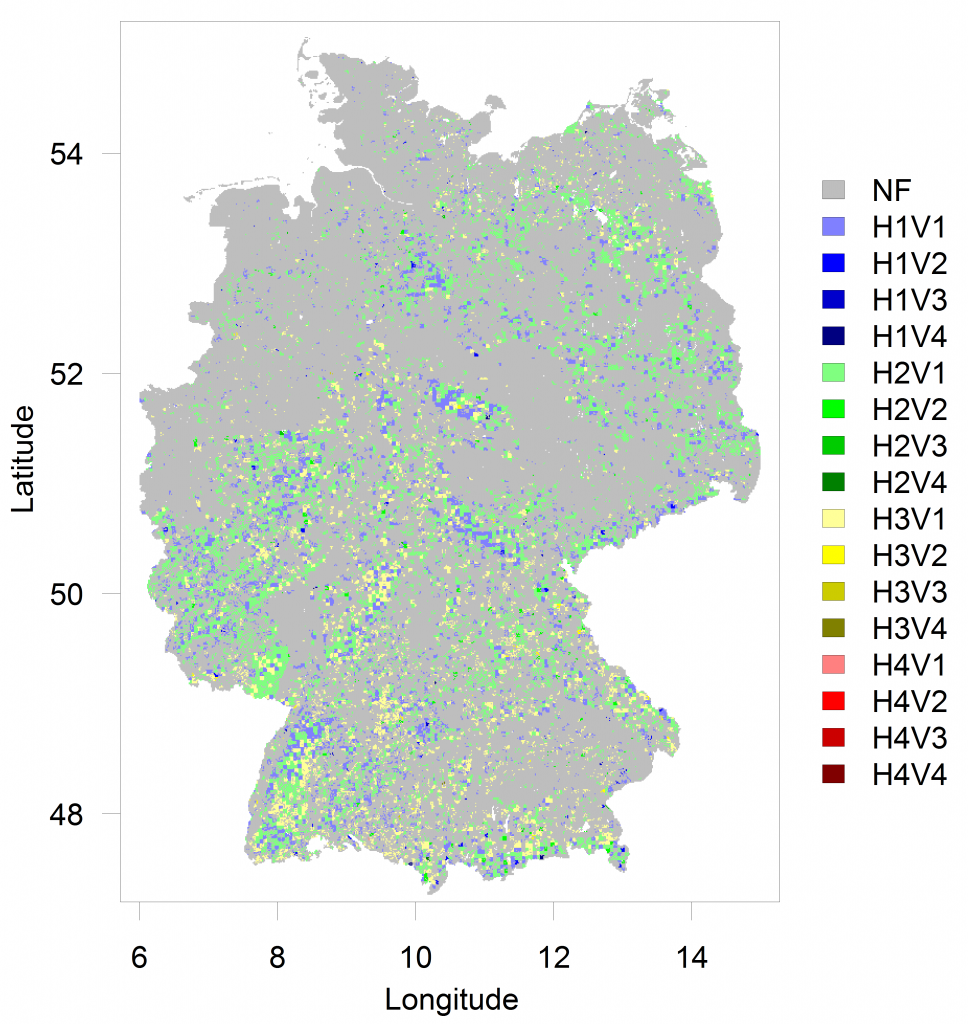
Figure 2: Map of horizontal (H) and vertical (V) forest structure types in Germany, based on simulated Lidar data from the German national forest inventory; NF = non-forest. Class 1 stands for a homogenous structure, class 4 for a very heterogeneous structure.
Future research will focus on the link between Lidar- and ground-based structure indices, the link between Lidar- and Radar-based structure indices and the influence of spatial scale on the height-to-biomass relationship.
Acknowledgements
We thank the Thünen Institute for providing the German national forest inventory (BWI) data.
References:
Pretzsch (2009). Forest Dynamics, Growth and Yield. Springer Verlag, Berlin, pp. 281
Reineke (1933). Perfecting a stand-density index for even-aged forests. Journal of Agricultural Research 46:627-638.
Contact: Helmholtz Centre for Environmental Research GmbH – UFZ, Department of Ecological Modelling. Andreas Huth, Rico Fischer, Nikolai Knapp